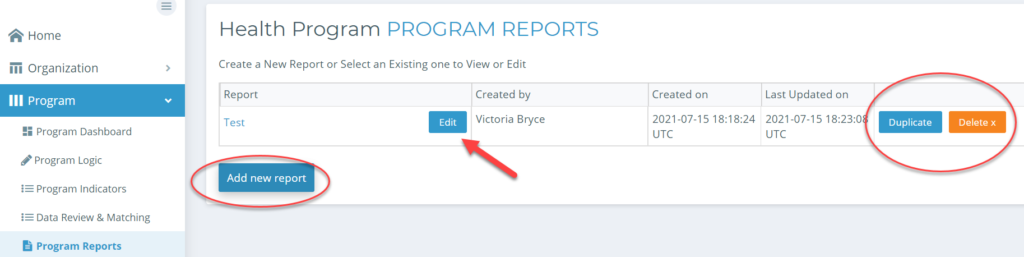
Start by selecting Program Reports in the side-bar menu under Programs.
• On this page, you can edit an existing report, or add a new report using the “Add new report” button.
• You can also duplicate or delete reports from here.
• Once you select to add a new report, you need to title and save your report.
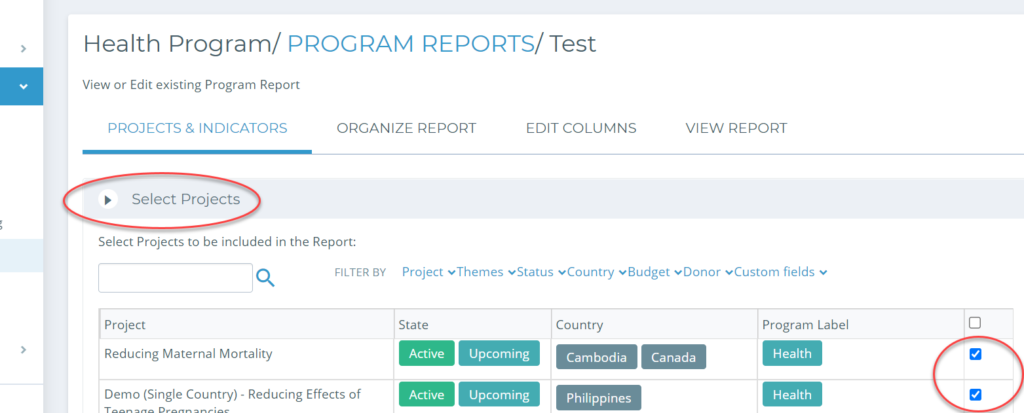
Next you can choose what indicators make it into your report.
• First, select the Projects you’d like the results to come from, and scroll down the page to select the specific indicators you’d like to see for that project. Use the box next to each entry or choose them all!
• Be sure to save your work at the bottom of the page using the “Save” or “Save and Next” button.
You can create the design of your report under the “Organize Report” tab. You can move the order of Indicators (those calculated from Project Details, as well as those aggregated from Project Results). When you are ready, select “Save and Next”.
This will take you right to the View Report tab.
• From the View Report tab, you can navigate back to the “Edit Columns” tab if you’d like to re-arrange your columns, hide them, or add custom columns.
In View Report, you can see the progress you’ve made, and see which projects correspond to your calculations. You can use the plus (+) to expand and view individual projects.
You can also see the details of your disaggregation (if you’ve chosen one/many) right in the report.
• It just shows “missing” for areas that have no data reported from the custom fields, but these might be replaced with a 0 input depending on preference.