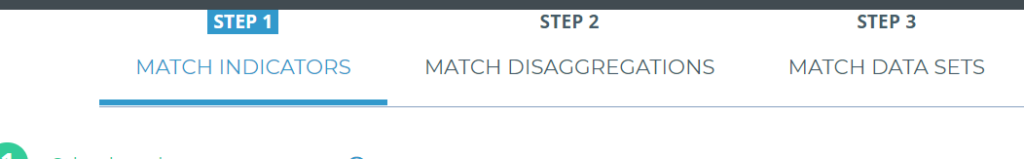
Within the “Data Review and Matching” page (you’ll find it under Program Indicators in the main menu on the left-hand side of your page), you will see three tabs that outline three steps:
Step 1: Match Indicators, Step 2: Match Disaggregations, and, in our next section, Step 3: Match Data Sets.
► Match Indicators
Step 1: Your first step is to match up your project indicators.
• Following this page, you have already done this in the previous section (when you added your program indicators), but you could do it here as well, or use it as an opportunity to review your matches.
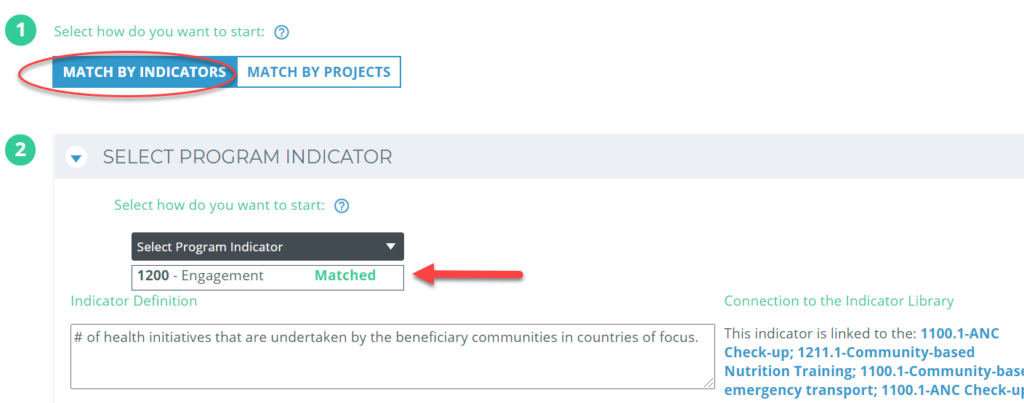
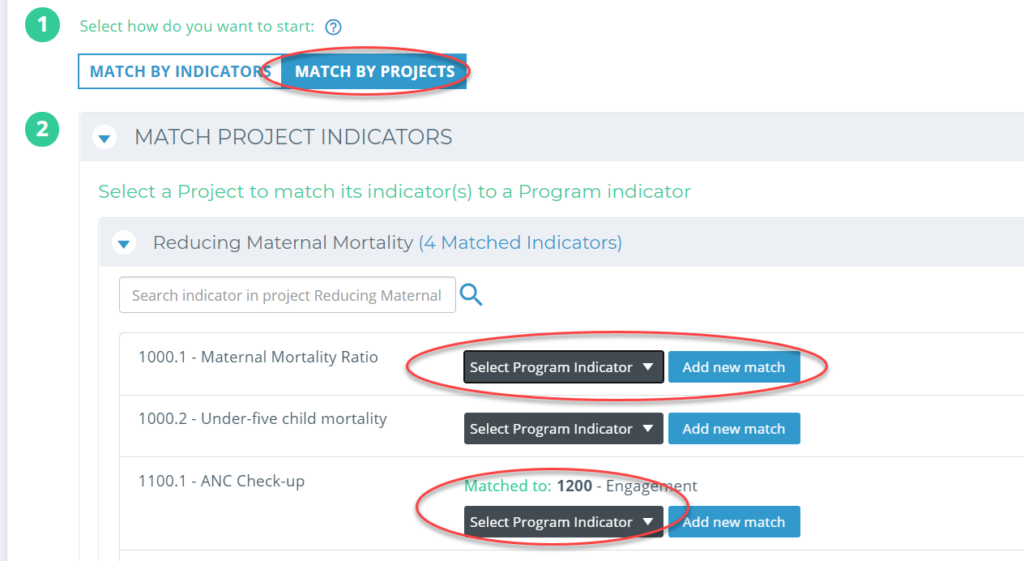
• You can choose to Match by Indicators, or Match by Projects. The Match by Projects function is useful in case you need to add a new project to an existing program.
Matching by Indicators allows you select the program indicator, and the details will appear below – alongside the list of project indicators it is currently linked to.
Matching by Project allows you to see all your projects connected to your program and can expand or collapse each to see its list of indicators.
• Find the ones you want to match, choose which program indicator to match it to, and select “Add new match”.
• Indicators that are already matched at the program level will say so as well.
► Match Disaggregations
Step 2: Now it’s time to create and match Program Indicator Disaggregation’s to the ones from a project level.
• As our First Task, select a program indicator.
• Next, you can add in the desired disaggregation for it that will show in the Program Report.
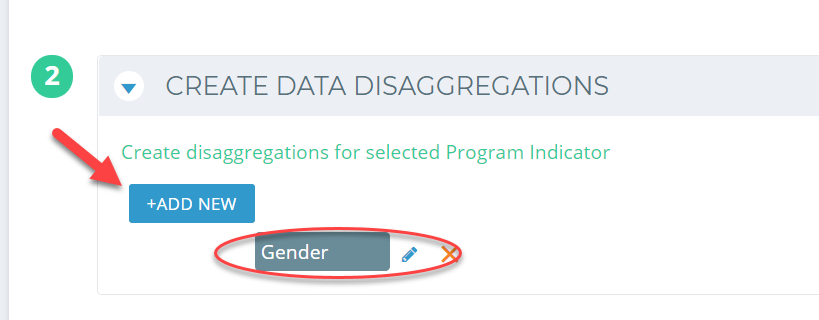
You can think of these labels like the disaggregation rows in the calculations for other indicators. You can also give it a custom colour.
Once this is done, you can scroll down to your third task, “Match datasets”.
For each project, you need to select which relevant Data Collection Tools you’d like to include in the aggregation.
• Start by choosing a project and selecting the relevant data collection tool from the columns.
• Since you have already matched your indicators, you will see a list of relevant results disaggregation for each project indicator. These are made of previous disaggregation from the project level.
• You want to use this matching step to make sure that Kinaki understands which groups of results are associated across different projects even if they may have different names or even not overlapping groups. This is done to be able to aggregate data from different contexts.
Here, you can see how our similar project indicators allow us to include relevant fields. For example, one project may have data with different terminology, such as “Men” or “Male”, and “Women” or “Female”. You can combine this data together by matching with the relevant disaggregation at the Program-level.
Just as in the animated image above, you can drag and drop the entries into the correct column under the data collection tool for this step, which you must do for each included project.
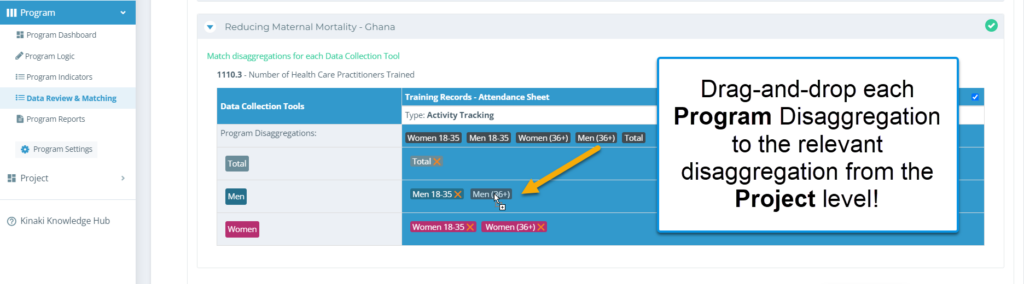
Other projects may not have any disaggregation. In which case Kinaki creates automated total, that represents all results under that data collection tool.
The Data Collection Tool under your projects may also have a Total listed among the disaggregation rows. You can use it or create your own by combining all the other disaggregation.
Some projects may not have any associated data collection tools, or have no existing data sets yet. In these cases, you will be unable to do any matching at this point. But you can come back later, once the data set for the project is submitted.