In this section, we’ll show you how you can use your datasets to measure progress towards your indicators that you created earlier.
Need to go back? Revisit the Design a Project Journey to see where you missed out or go directly to the Indicators page.
For this page, we’ll focus on different ways to view your results and give you tips for presenting information directly into a report. Just make sure you create a report first so you have something to add to.
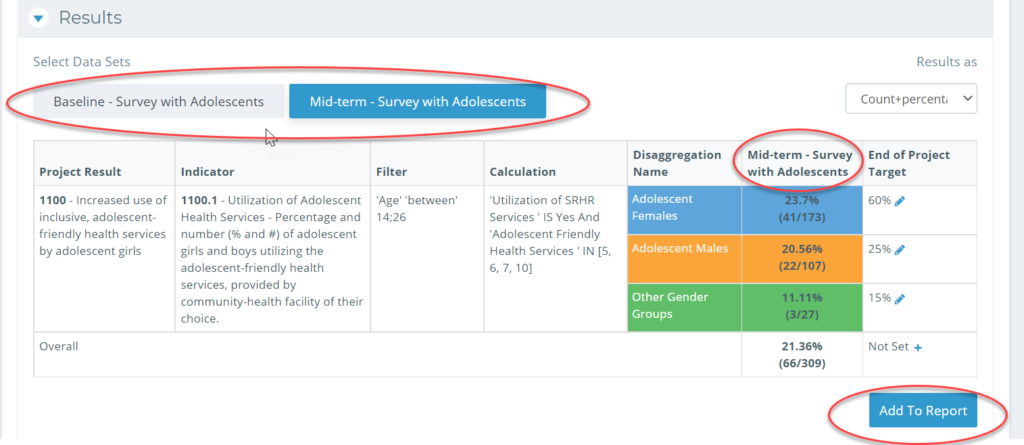
To see the results of the indicator for the different datasets, scroll down to the Results tab, and select the datasets to load into your results.
When you have selected a dataset, it will highlight in blue and appear in your column. You can add this directly into a report by selecting “Add To Report” on the bottom right-hand side of the page.