You can group datasets together to display results from different Data Collection Tools side by side, but under one column in your report.
With different data collection tools (say activity tracking and a household survey), you can’t necessarily combine or aggregate the results (as they are using a different methodology), but you might still want to see them next to each other.
This function allows you to compare datasets in a clear visual way.
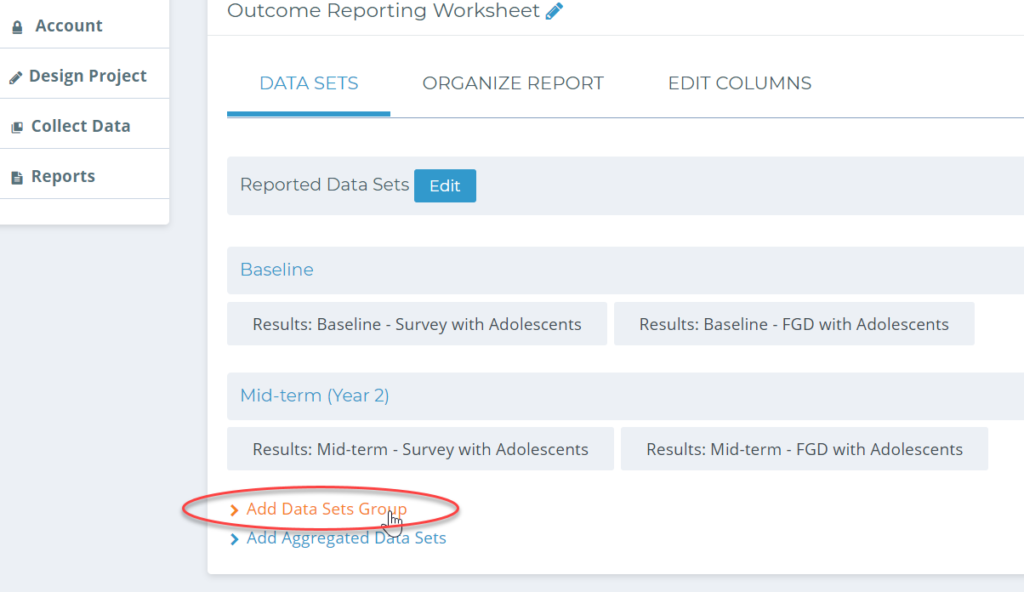
To add a Dataset Group, click on “Edit Report” and then under “Data Sets” click on “Add Dataset Group”.
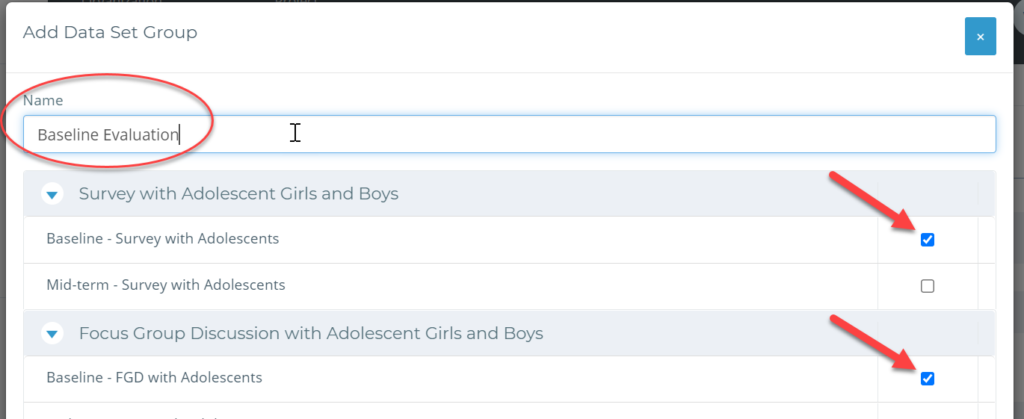
• Name your Dataset grouping and select which datasets to include by checking them off on the right-hand side.
• Click save when you are done and check out your new columns by returning to your main report page and scrolling far over to the right. You can then move the columns around back in “Edit Report”.
Awesome! Your project report is shaping up already!
Well done! Your project report is looking great!
Check out Chapter 8 of this video to learn more!