Disaggregating your data will separate responses in the analysis based on the responses to the questions that you have chosen for the calculation (location, gender, etc.).
For example, participants might be asked what community they are from, and select from a list of three responses (A, B or C) – allowing the data to be disaggregated to highlight the different locations that participants are from.
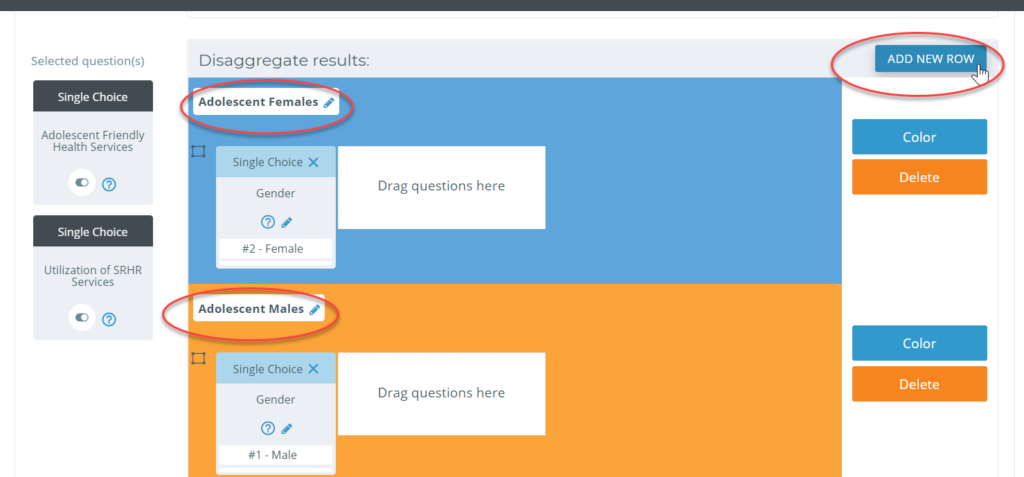
You can add any number of disaggregation lines to your indicator calculation, using the “Add New Row” button on the right side of the page. Each disaggregation line will create a unique section in your analysis.
Drag-and-drop a question and select the appropriate response to disaggregate your data. Multiple questions may feed into the same results.
For disaggregation rows that uses a “VALUE” result, leave the “Calculate results by” section empty. This will include questions only for the disaggregation row and filter.
Each disaggregation row can contain a unique calculation, often similar but separated by different response choices. Adding a question to the calculation will shift these results, and is not necessary with Kinaki.
When you’re ready, select “Calculate Results” at the bottom of the section, and continue onto the “Results” tab.