Once you have an indicator selected that you want to analyze, and you are happy with all the indicator details you see, scroll down your page past Indicator Details tab, and you’ll see the next one called “Questions & Calculation”. This is where you can organize your analysis.
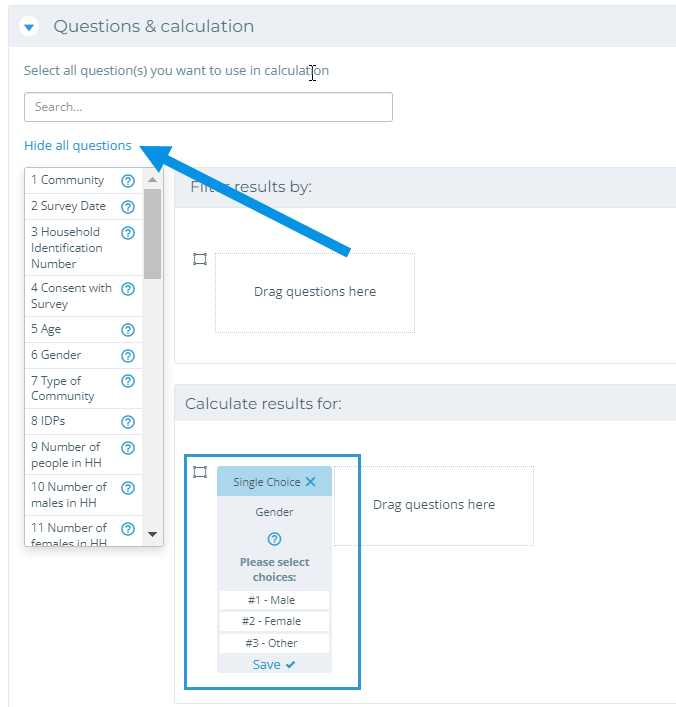
• On the left side of the page, you will see a list of questions that contribute to the results for the chosen indicator. You can also select “Show All Questions” and choose one from the list, or use the search function.
Beside the list of questions you will see two sections: “Filter results by” and “Calculate results by”. You will first fill the “Calculate results by” section then move on to “Filter results by”.
• Use your cursor to click on and drag these questions into the “Calculate results for” section.
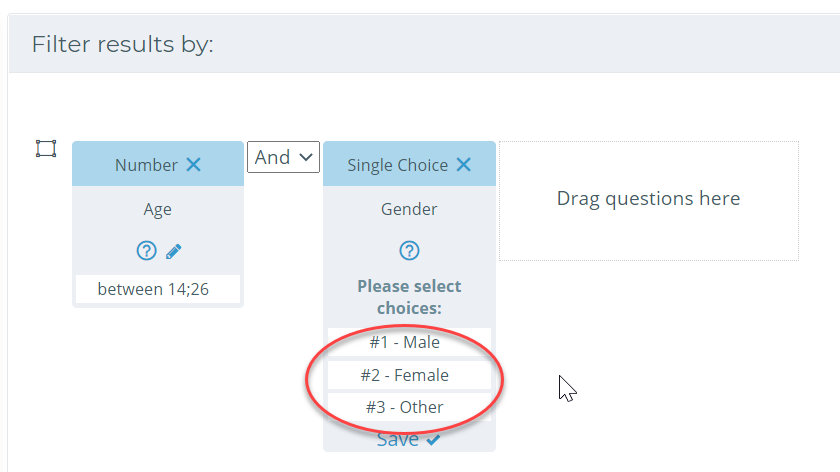
• Then, select which answer option you want the results calculated for (i.e. if you only want to see ages 14-26, and not the other age groups that were asked about).
• For numerical responses, you can select greater than (>), less than (<), equal (=), less than or equal (<=), higher than or equal (>=), not equal (!=), and “between”. Then you set value(s) the numbers will be compared against. “Between” behaves as a closed interval and does include the end values.

• To use the question in a numeric mode, choose “VALUE”, now you will not be comparing the values to the like in the logical calculation, but you will be able to calculate averages, totals/sums, and other numerical values from your data. This mode is useful for example to calculate the average age of respondents for survey data, or the total number of people trained for training data.
• For choice questions, Kinaki will also show the number associated with each response (in the example below, yes or no have 1 and 2), this number is generated by Kinaki to enable easier orientation. It is not part of the answer.