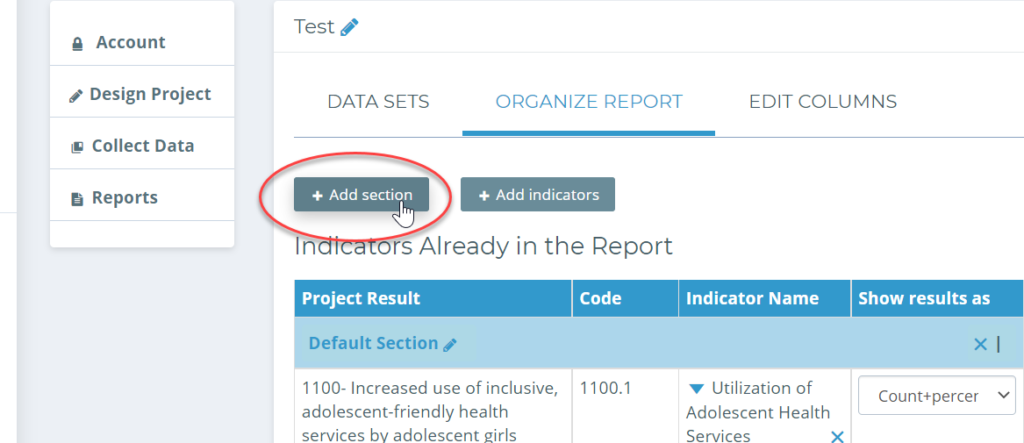
Using the “Organize Report” tab, you can change the order in which the indicators show in a report (remember that indicators attached to a single result will always stay together).
By default, all of your information is organized into a single section – but you can change this and sort your report by different sections, by clicking on “+Add section” and then you can title and sort it however you like.
If the values in your report appear as incorrect values, you can change the presentation format on the Organize Report tab of the Report Settings. Here, select from the list from “Show result as” options to find the correct format.
For example, numerical values may be set to “Average” by default and appear as an incorrect fraction value, but must be changed to “Sum” to show the true values.
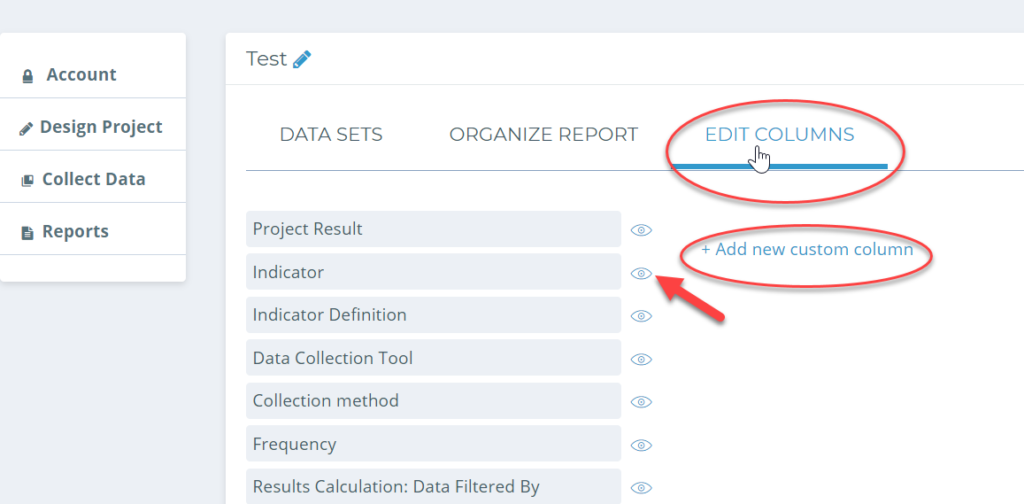
In the “Edit Columns” tab, you can choose which information is visible in your report. Select the eye icon to show or hide a column.
Remember: additional columns will provide a greater depth of information but it will increase the horizontal size of the report!.
Here you can also add, show, hide, or remove custom columns.
Check out Chapter 7 of this video to learn more!