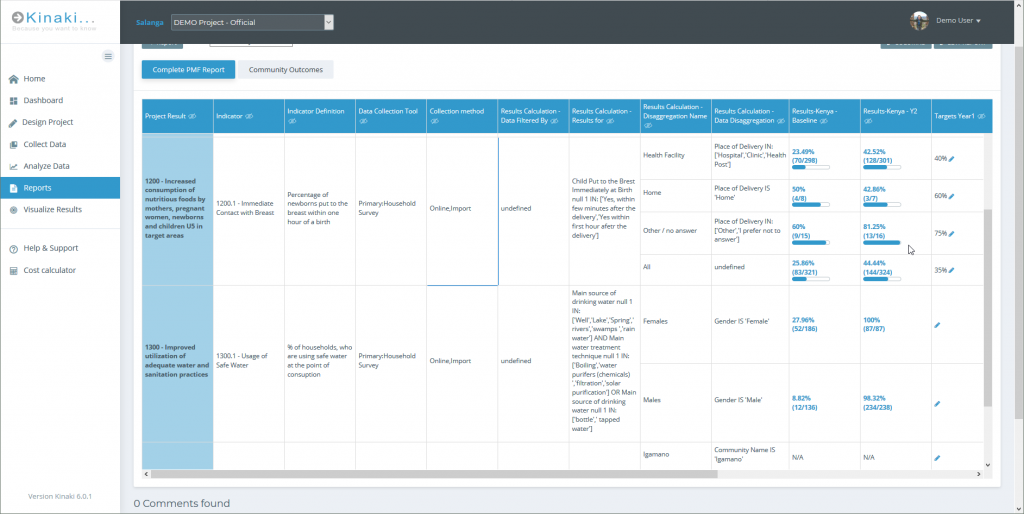
Reports
Under the “Project” tab in the main menu the “Reports” section will allow you to generate, edit, and compile data for further analysis and tracking. These Reports are based on the project data and measures that you have included in Kinaki.
How do I create a report?
On the “Report” homepage, you will see all available reports from your organization. To create a new report, select the “+ Report” button and use the title menu to name your report.

Adding Datasets to a Report
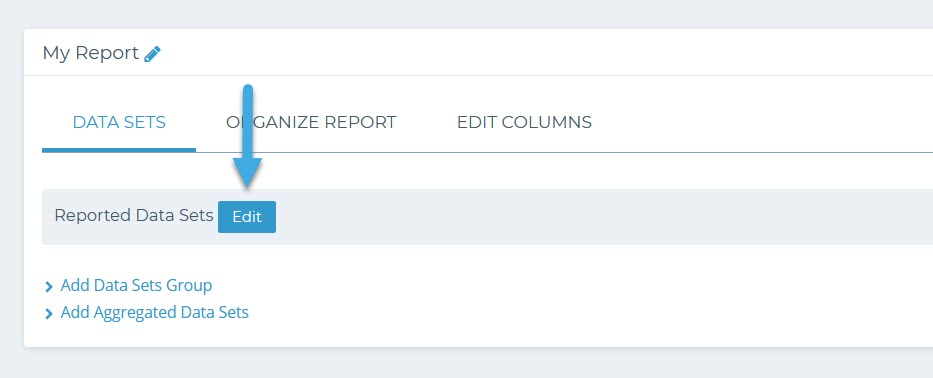
Once you have created your first report, you can begin to generate the data by selecting “Edit Report”. This will take you to the “Report Settings” page.
From Report Settings, you can select the relevant data set(s) to include in your report. This will be the collected data that you want to highlight and analyze. Select “Edit” under “Reported Data Sets” and choose from the list compiled of your data.
Save your selection by choosing “Save” at the bottom of the page.
How do I add an indicator to my report?
To Add an Indicator to a Report, go to Analyze Data, select the appropriate Data Collection Tool, select the indicator, and after calculating it click on “Add to Report”. In the window that appears, select all the reports to add this indicator to, and the style in which the result should be shown.
Adding Multiple Indicators to a Report at Once
To add many indicators to a single report at once, click on “Report Settings” and “Organize Report” and then on “+ Add Indicators”. Then you can select the indicators to add to the report and confirm by clicking “+ Add Selected INdictaors” at the bottom of the window.
Changing Order of Indicators in a Report
Using the “Organize Report” tab, you can change the order in which the indicators show in a report. Please keep in mind that indicators from a single result will always stay together.
You can also sort indicators into different sections. By default, all information is organized into a single section.
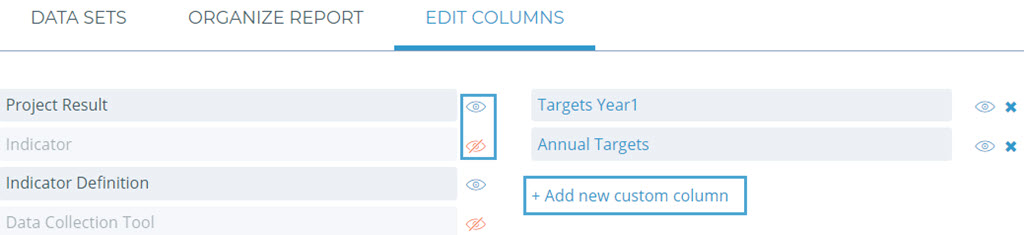
Reordering and Hiding Report Columns
By selecting the “Edit Columns” tab, you can choose which information is visible in your main report. Select the eye icon to show or hide a column. Additional columns will provide a greater depth of information but will increase the horizontal size of the report.
Custom Columns
You may also use the Columns section to add, show, hide, or remove custom columns. To fill in data to a custom column point at the call in a report where you want to fill in the information. Edit button (pencil) will appear and after clicking it you can add the desired value.
How do I group datasets in a report?
Dataset Group allows you to see datasets from different Data Collection Tools in one column. This way you can for example combine under column 2021 data from both an activity tracking form as well as from a household survey.
To add a Dataset Group click on “Edit Report” and then under “Data Sets” click on “Add Dataset Group”.
How do I add an aggregated dataset to a report?
Aggregated Datasets allow you to combine data from multiple datasets within the same Data Collection Tool. For example, you can aggregate data from quarterly activity tracking to get numbers for the year.
To aggregate datasets click on “Edit Report” and then under “Data Sets” click on “Add Aggregated Dataset”.